

Our way to a fancy QA automation reporting
Discover a faster and more efficient way to create automated QA reports: We’ll guide you through the best QA reporting tools and the most optimal processes so that you can integrate them with Jira and TestRail and save you an incredible amount of time!


In our relentless quest to find the best processes, we tested different QA automation tools such as Serenity, Cucumber, and Allure to find the best fit. Here’s a step-by-step guide to creating the best, most efficient, easily-readable automated QA reports containing all essential tag information while reducing time-costly tasks, saving both you and your team countless hours of work. Let’s get started!
Written by:
 |
Aleksandr Petukhov, Senior QA Engineer at Nuvolar |
QA automation tools: Our first experiment with Allure
Various different options were tried in order to experiment and create this article. All of them had something in common, such as the trend chart or the feature to display the number of passed/failed scenarios.
Previously, we were using the Serenity reporting tool which has a good example of a pie chart with statistics.
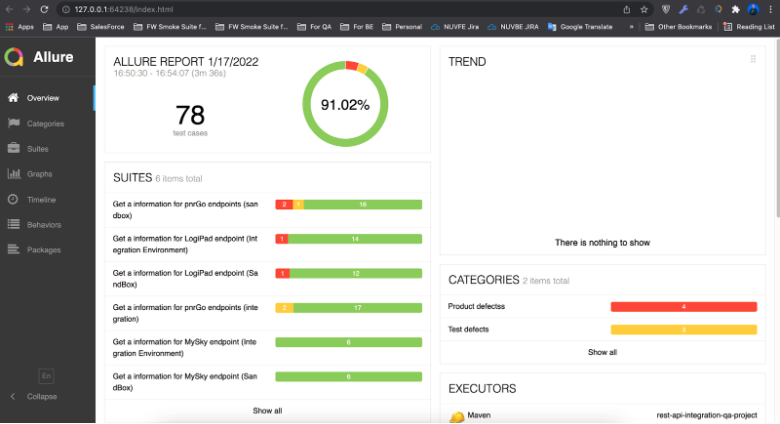
When we decided to experiment with different reporting tools, we chose Allure Framework because it allows users to not only check the status of the test-execution process but also to look way deeper and extract a maximum of useful information from everyday test execution.
The first step was integrating Allure into one of our projects, and here we faced our first problem: the Serenity framework-related reporting tool we used before wasn’t going to work with Allure, so it had to be removed from the project structure and Allure was added instead.
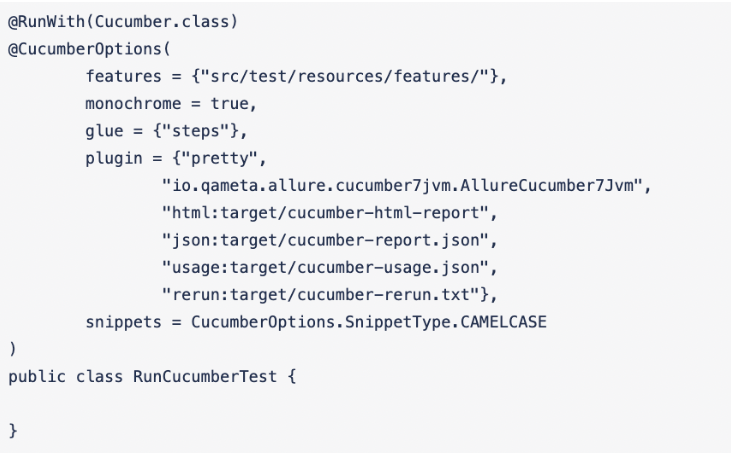
This time we used Cucumber in our test project. It’s a good way to manage test cases because Gherkin (used in the Cucumber framework) makes test cases easily readable and understandable from a non-QA point of view.
As we’re using Cucumber, you’ll be required to update the plugins list in the Cucumber Runner class to then add Allure there.
Also, some Maven configuration updates were needed:
- Add encoding.
- Add a java agent for aspectJWeaver.
- Include our runner Cucumber class.
- Add mandatory system property variables: results report directory, Jira pattern, TestRail pattern.
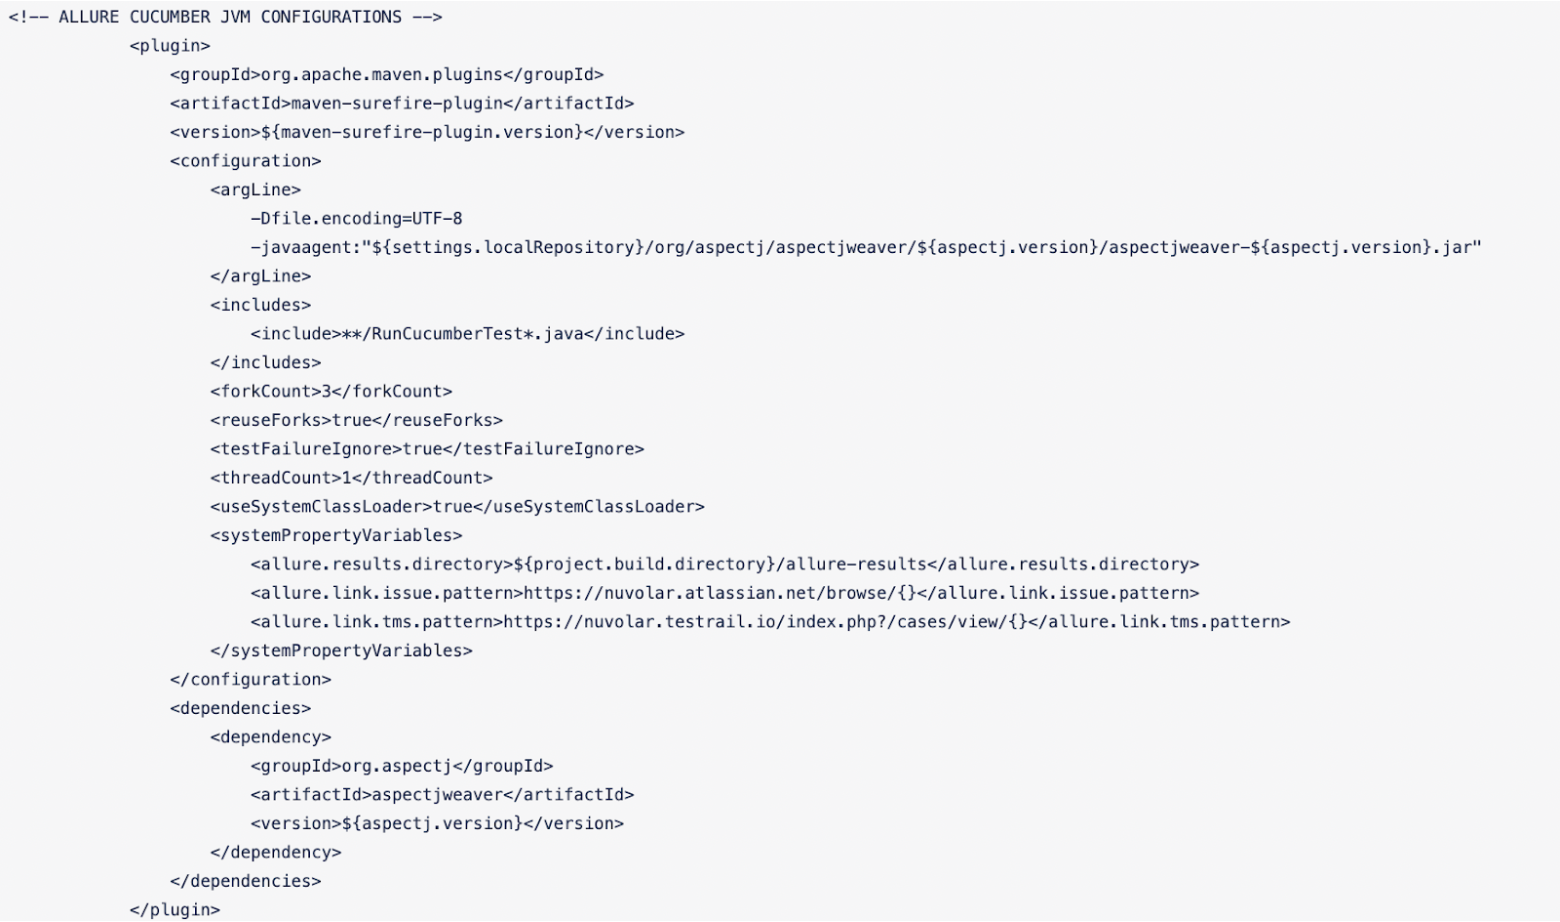
- Add io.qameta.allure plugin into pom.xml.

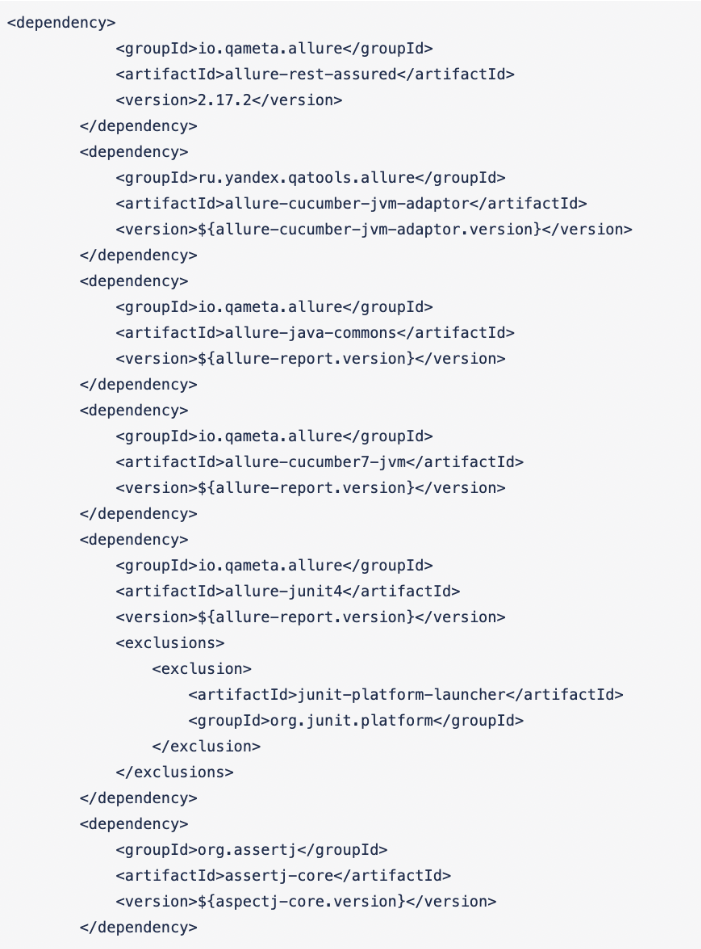
- Add dependencies into pom.xml.
Running the first test
Once everything has been configured, then the time has come for the first test run with an updated reporting tool to start.
Depending on the Maven-Surefire configuration, there can be several options to execute a test run. For us it’s a simple mvn clean test && mvn allure:serve.
When the mvn clean test has finished, mvn allure:serve will start doing its job:
- A report will be generated in the target folder (example:target/site/allure-maven/index.html)
- As the report is ready, the next step is to start the Jetty server
- A browser will be opened in a separate window and the Allure report will be displayed
Why switch from Serenity to Allure?
Let’s finish with the technical part and discuss the main idea: Why did we change from an already working option (the Serenity reporting too) to Allure? The answer is the rich amount of options provided by Allure.
As those who frequently check QA reports, collect statistics and try to improve our reporting user experience on a daily basis, we’d like to be able to easily identify problems, localize their source and be able to quickly fix them.
It doesn’t matter which side the defect is on: Whether it’s on the application’s side, or in places where tests are no longer relevant and should be updated.
Regarding the latter, there are also many useful features for that in Allure.
Flaky Test: including marks for what should be fixed
Sometimes we face issues with unstable tests, there are a lot of reasons why this could happen; if we’re talking about Front-end tests the reason could be, for example, a StaleElementException problem which can appear from time to time on specific elements on the UI part.
This will depend on the stack of technologies used to display the UI part and can be fixed by the reinitialisation of such elements within the test code. But before doing so there might be more urgent tasks, so to not to lose time doing this failing test periodically, it can be marked as @flakky.
This way the reports showing the following failures will contain a mark showing that the current test is unstable and should be fixed, here’s how it looks:

In comparison with Serenity, it only has an option to retry N times, but to not to mark things as flakky, it means if compared with Allure, Serenity is not as informative.
Environment: Creating the right properties
If tests are being executed on different environments and it is critical to know the exact configuration of the environment being used, it’s possible to display this information in the report.
It can be added by creating environment.properties (or environment.xml) file within allure-results directory:
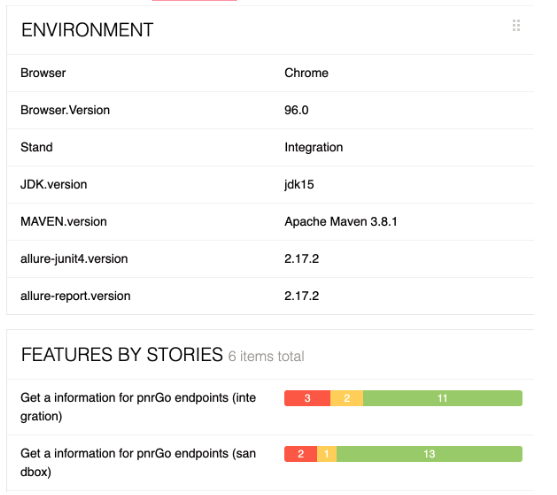
Adding Categories
- Product defects (failed tests)
- Test defects (broken tests)
To create custom defects classification; add categories.json file to the allure-results directory before starting the report generation.

- (mandatory) category name
- (optional) list of suitable test statuses. Default [“failed”, “broken”, “passed”, “skipped”, “unknown”]
- (optional) regex pattern to check the test error message. Default “.*”
- (optional) regex pattern to check stack trace. Default “.*”
In comparison with Serenity, it has no custom categories, only basic ones, broken, failed, skipped, etc. So allure allows customizing workflow and reports much better.
Jira & TestRail integration: Identity what’s wrong
Now for my favorite part; by configuring properties, we’ll be able to connect our reporting tool with Jira and TestRail
<systemPropertyVariables>
<allure.link.issue.pattern>https://nuvolar.atlassian.net/browse/{}</allure.link.issue.pattern>
<allure.link.tms.pattern>https://nuvolar.testrail.io/index.php?/cases/view/{}</allure.link.tms.pattern>
</systemPropertyVariables>
Allure will be replaced with {} placeholders with value specified in annotation:
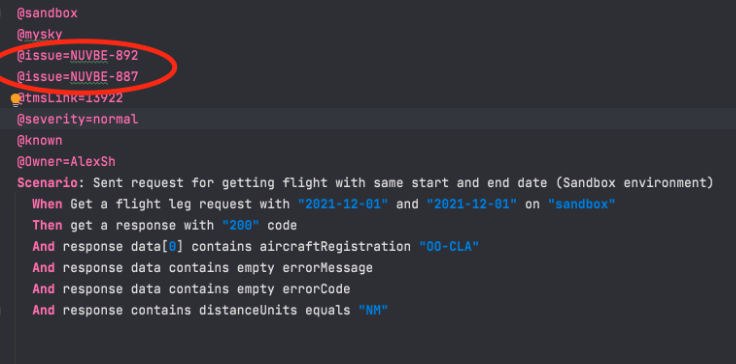
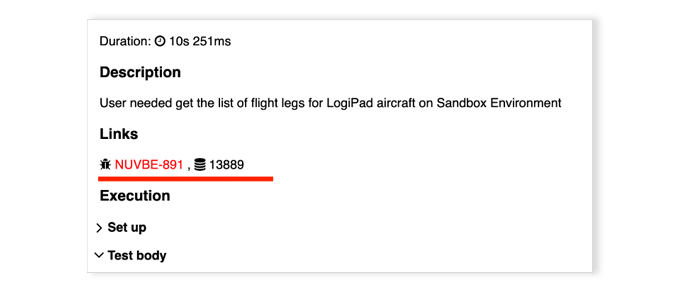
In reports, the tags @issue and @tmsLink will be displayed as links to Jira and TestRail, they will be clickable, and will navigate to the story or test case which is being notified in the test you’re writing, like this:
Adding Custom tags
If you’d like to differentiate a test case you’re adding by any tag, you can easily do it.
Simply add it as an annotation as @{tag} where {tag} can be replaced by any word or number and it will be displayed in the report.
Best QA automation tools: Allure’s wide list of advantages
In conclusion, when we decided to try Allure reporting we already knew it contained various options that would make our lives much easier, but we didn’t realize how interesting and valuable it would be to actually integrate and use it.
Now, we receive fancy reports on a daily basis, which are:
- Easy readable
- Contain numerous tags we need to identify problems and cases
- Complete with all the necessary information about the environment where tests are being executed
- Saving us an incredible amount of time (the best part) thanks to the fact we’re able to quickly navigate from Jira to TestRail to identify and specify what goes wrong.
About Nuvolar:
We are a digital innovation consulting company dedicated to one unique purpose: helping businesses adopt world-class software solutions on the cloud so they can succeed!


Give me the latest news!
Welcome to Nuvolar’s blog. Subscribe to stay up to date with our latest news.

